
Working research · Version 2 · 30 October 2026
An ancestry coverage audit of 108 pharmacogenomic recommendations
Preprint draft · not peer reviewed
Pharmacogenomic guidance turns a genotype into a prescribing decision. The frequencies that make that guidance operational come from particular study populations. This audit asks a narrow, checkable question of one public database: for how many recommendations does the CPIC API actually return a computed phenotype frequency, and for which ancestry groups?
A descriptive database audit, not medical advice. It records which fields are populated in a dated snapshot of a public API. It is not a systematic review, it does not assess whether any guideline is clinically adequate, and it does not estimate anyone’s individual risk.
1. Forty-six of 108 pairs lack a computed phenotype frequency
We retrieved the CPIC public API on 30 October 2026 and selected every pair at evidence level A, A/B or B with usedforrecommendation = Yes: 108 pairs, 21 genes, 27 guidelines. For each, we asked whether the gene carried a value in CPIC’s computed phenotype-frequency field.
For 62 of the 108 pairs, a phenotype frequency was present for at least one ancestry group. Forty-five pairs had allele-frequency records but no computed phenotype-frequency value, and one pair — ivacaftor and CFTR — had neither.
These categories describe which fields are populated in this snapshot. They do not measure the completeness of published evidence. CPIC recommendations can key on phenotype, on an activity score, or on allele status, and an absent phenotype field is not evidence that a guideline is unsupported or that a frequency has never been measured.
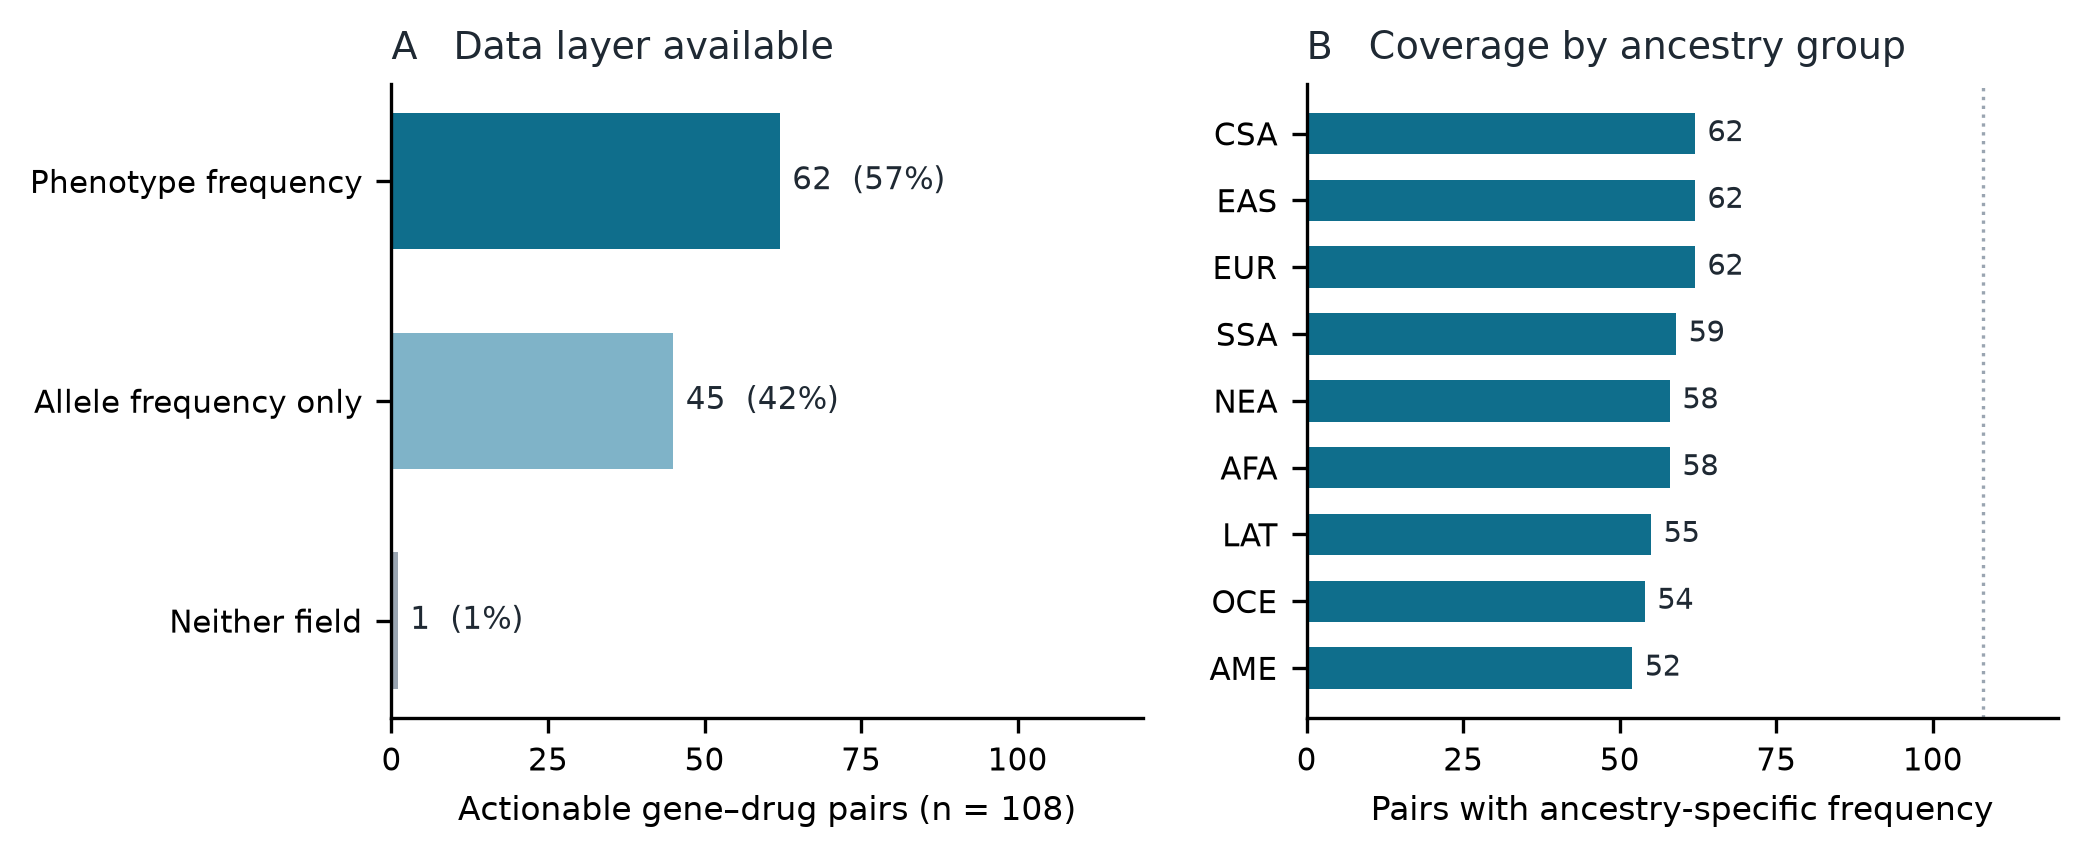
Where phenotype frequencies were present, they were often incomplete. Six of the ten genes with any phenotype frequency covered fewer than nine ancestry groups:
| Gene | Groups with a phenotype frequency | Missing |
|---|---|---|
| NUDT15 | 4 / 9 | African American, Sub-Saharan African, Near Eastern, Oceanian, American |
| NAT2 | 5 / 9 | African American, Near Eastern, Oceanian, American |
| CYP3A5 | 7 / 9 | Oceanian, American |
| TPMT | 7 / 9 | Oceanian, American |
| CYP2B6 | 8 / 9 | American |
| SLCO1B1 | 8 / 9 | Latino |
This is an observation about the snapshot. It does not show that NUDT15 has never been measured in those groups, and it does not support ancestry-based dosing decisions.
2. Where phenotype frequencies exist, they differ across groups
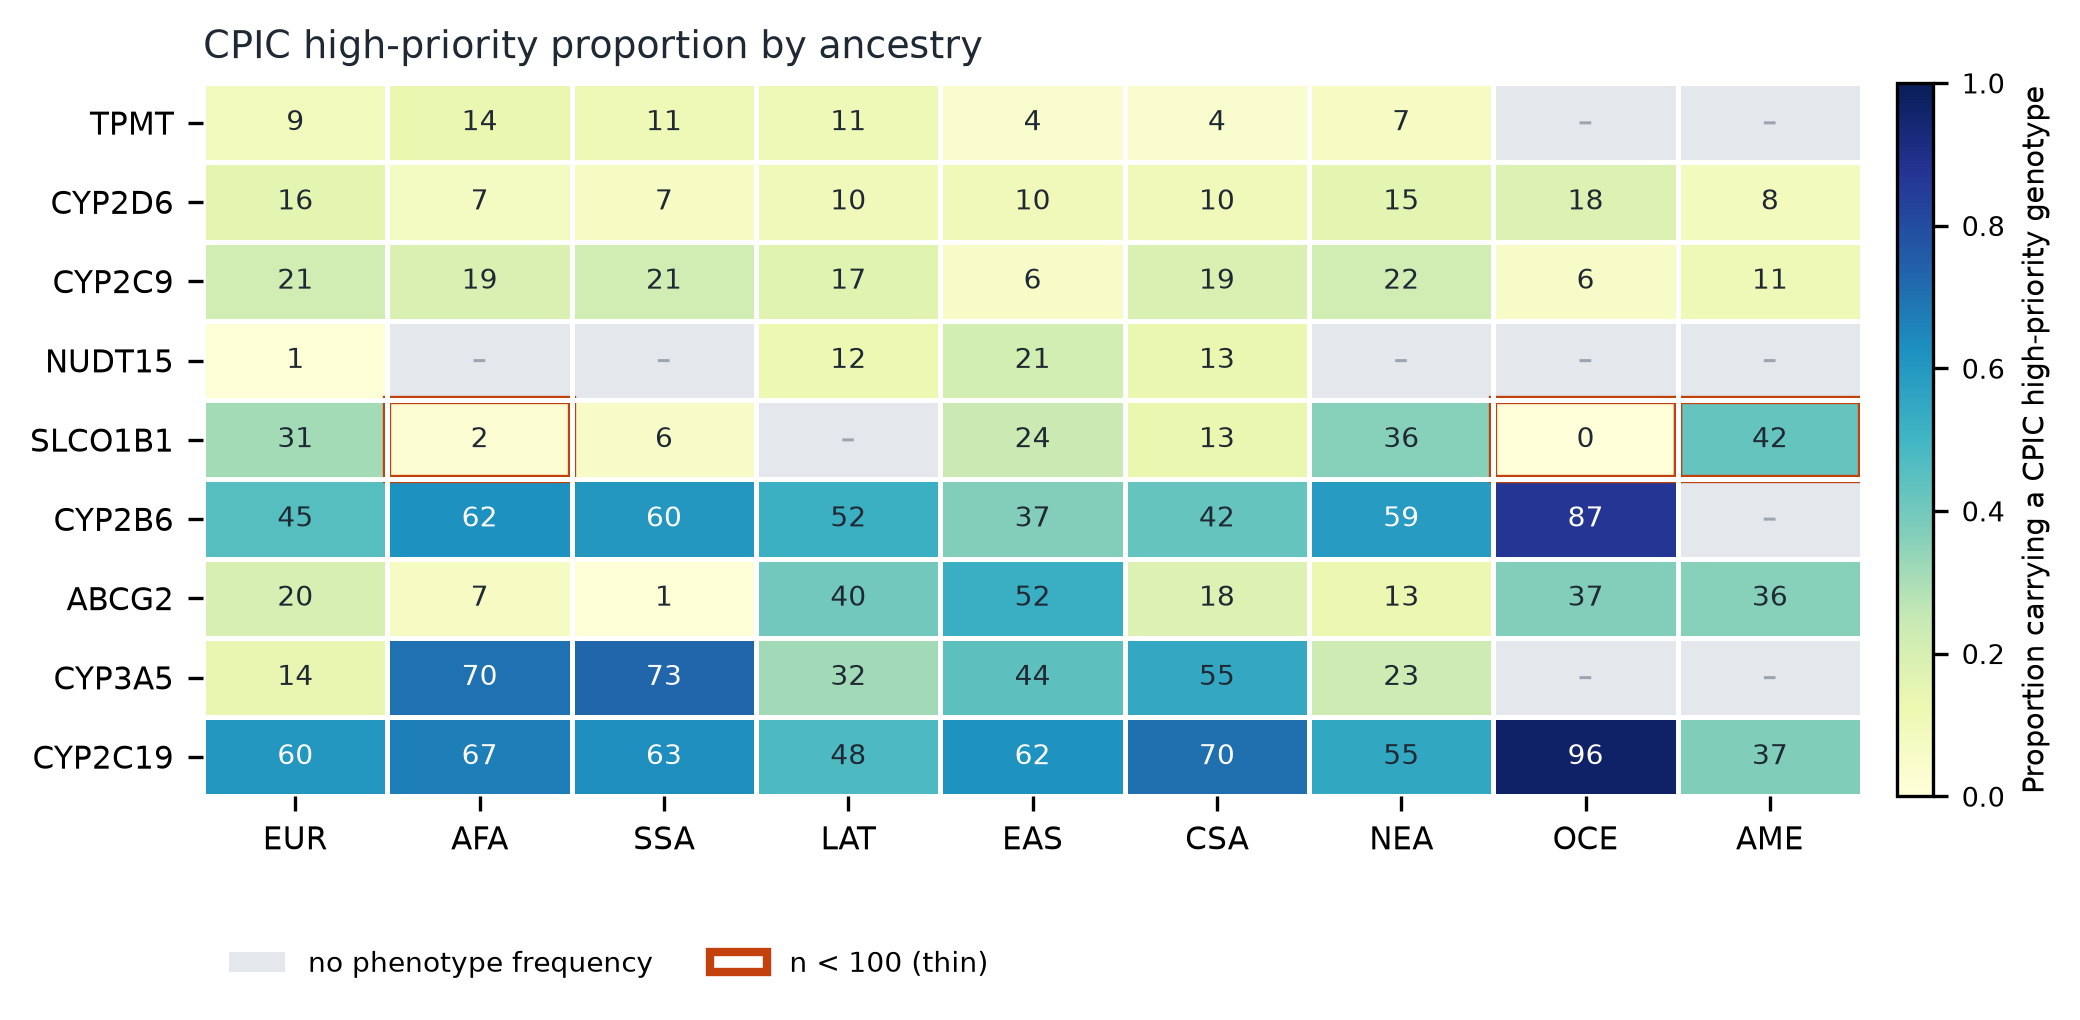
For genes with phenotype frequencies we summed the categories that CPIC’s own ehrpriority field marks for clinical attention. We call this the CPIC high-priority proportion. It is a clinical-attention label, not a calibrated probability of harm, and it aggregates categories that can move in different directions — an ultrarapid and a poor metaboliser are both flagged, for opposite reasons.
Sixty-one pairs had enough data to rank. The median difference between the lowest and highest ancestry group was 16.1 percentage points, and 25 pairs exceeded 20 points. Those 25 pair-level results are not 25 independent biological contrasts: they repeat five gene-level estimates — CYP2C19 (14 pairs), SLCO1B1 (7), CYP2B6 (2), ABCG2 (1) and CYP3A5 (1).
| Gene | Lowest group | Highest group | Gap (points) |
|---|---|---|---|
| CYP2C19 | American · 37.2% | Oceanian · 96.5% | 59.3 |
| CYP3A5 | European · 14.3% | Sub-Saharan African · 72.9% | 58.6 |
| ABCG2 | Sub-Saharan African · 1.2% | East Asian · 52.0% | 50.8 |
| CYP2B6 | East Asian · 37.0% | Oceanian · 87.0% | 50.0 |
| SLCO1B1 | Oceanian · 0.0%* | American · 42.2%* | 42.2 |
| NUDT15 | European · 1.4% | East Asian · 20.8% | 19.4 |
| CYP2C9 | East Asian · 5.6% | Near Eastern · 21.7% | 16.1 |
| CYP2D6 | Sub-Saharan African · 6.7% | Oceanian · 17.7% | 11.0 |
| TPMT | Central/South Asian · 3.7% | African American · 13.5% | 9.8 |
*The SLCO1B1 value is a composite: the American 42.2% is 36.48% Decreased Function plus 5.76% Poor Function, not Decreased Function alone. Both SLCO1B1 cells carry a support proxy below 100 — see section 3. CYP2C19, not SLCO1B1, is the largest contrast in the table.
3. The support proxy, and what it cannot tell us
For each gene × ancestry cell we recorded the largest subjectcount among the allele-level records contributing to it. This is a sample-support proxy. It is not a demonstrated denominator for the phenotype estimate, not a count of unique people, and not an effective sample size.
Three of 75 cells had a proxy below 100, all for SLCO1B1: African American/Afro-Caribbean 38, Oceanian 28, American 64. The Oceanian cell is 0.0% and the American cell 42.2%.
It is tempting to call that contrast an artefact. This audit cannot support that. We did not reconstruct a denominator, propagate uncertainty, or examine the contributing cohorts, so we cannot say whether the contrast reflects sampling variation, cohort composition, modelling assumptions or a population difference. It requires cautious interpretation and further validation — a conclusion that applies to every cell here, not only the small ones.
4. HLA carrier frequencies
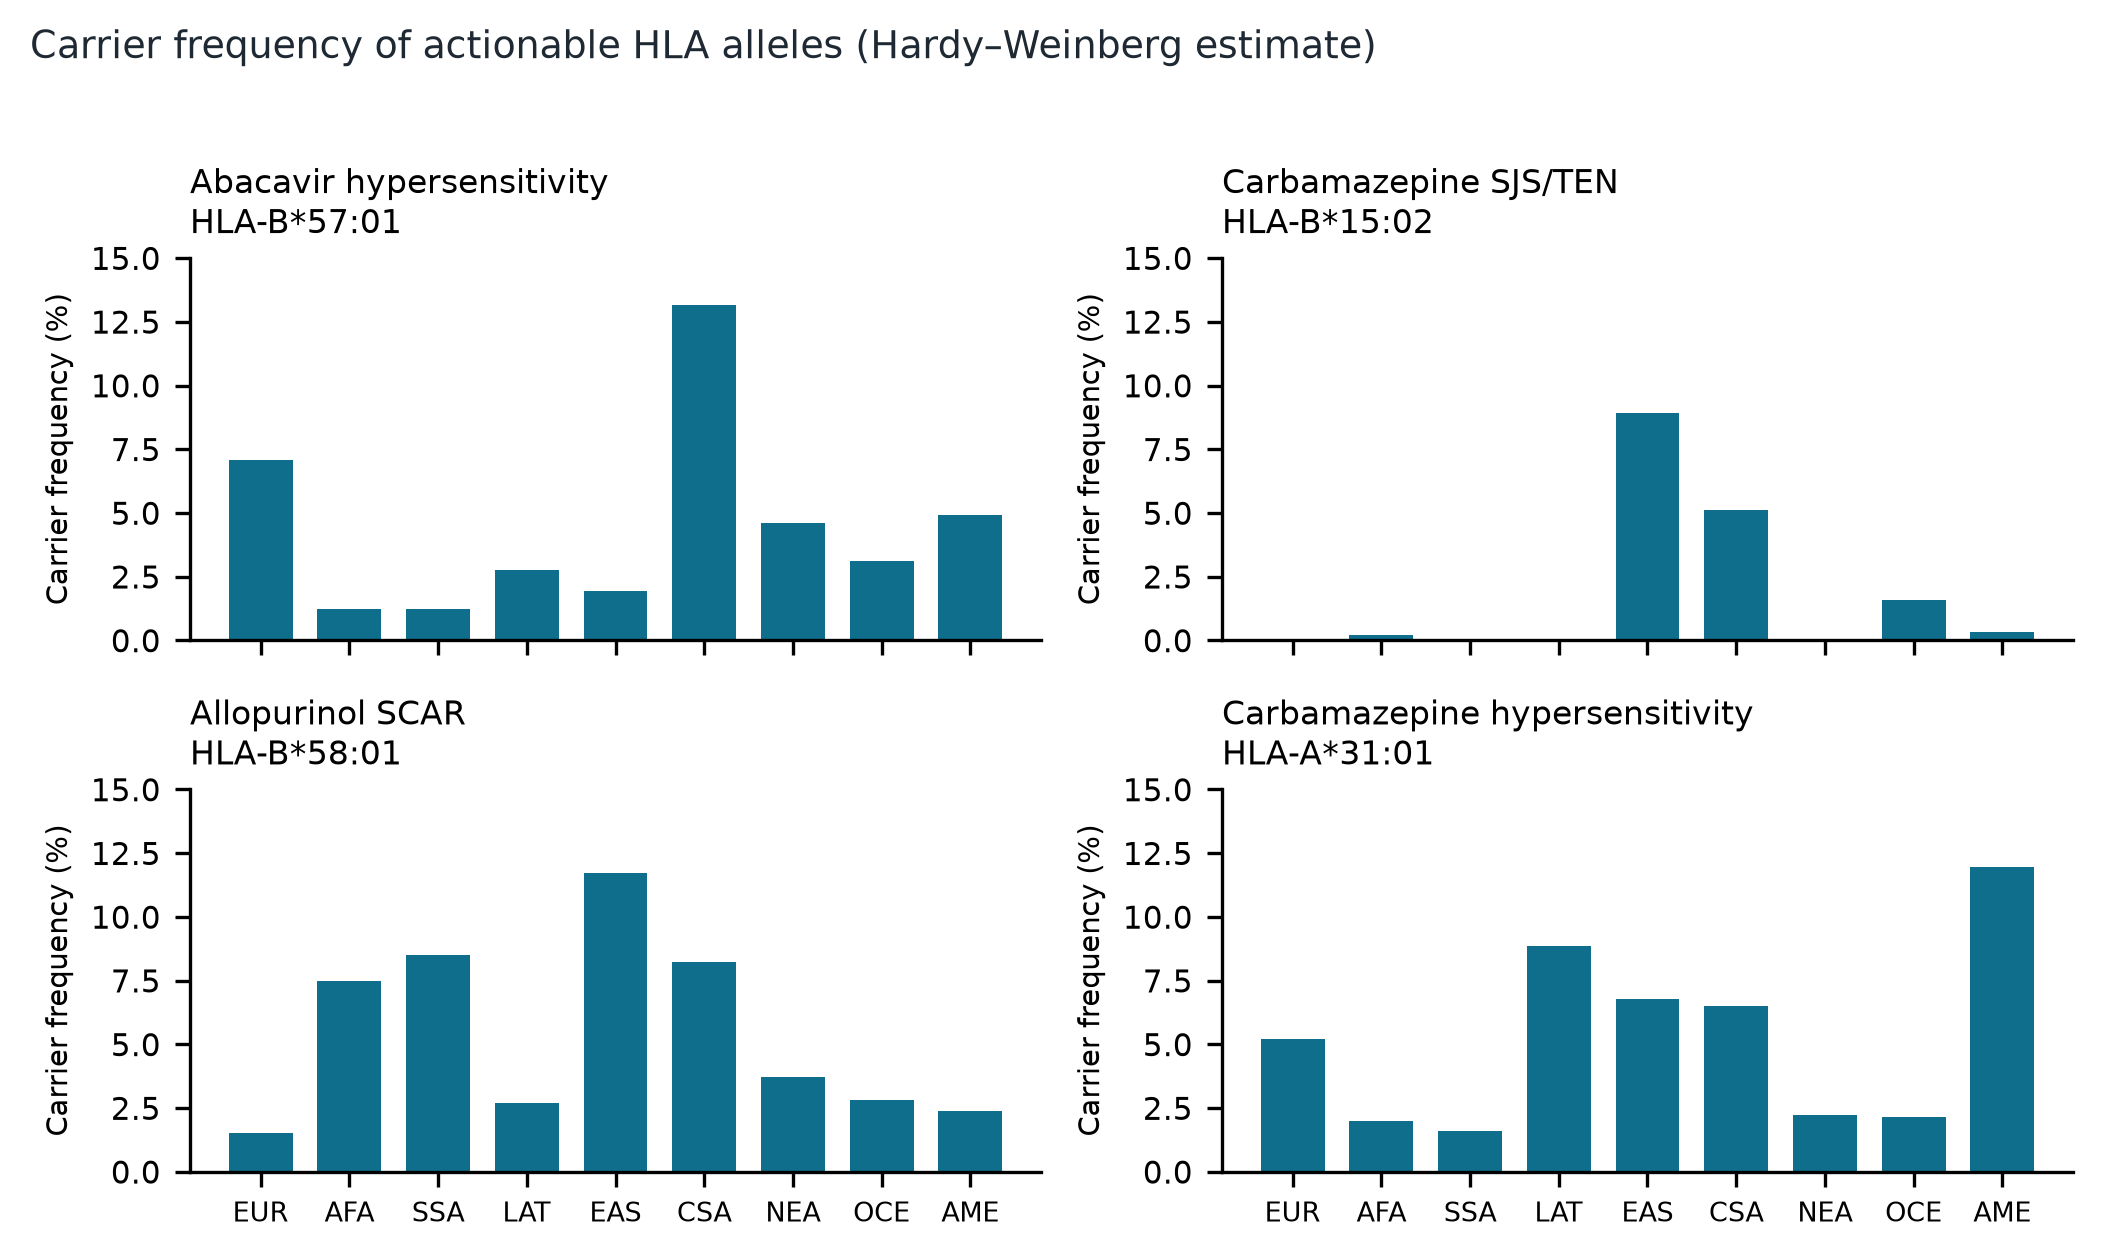
For genes where the actionable unit is a single allele, the allele table is the relevant measure. We estimated carrier frequency under Hardy–Weinberg as 1 − (1 − p)².
HLA-B*57:01, the abacavir hypersensitivity marker, ranges from about 1.2% of African American/Afro-Caribbean and Sub-Saharan African groups to 13.2% of Central/South Asian groups. HLA-B*15:02 ranges from approximately 0% to 8.9%, HLA-B*58:01 from 1.5% to 11.7%, and HLA-A*31:01 from 1.6% to 12.0%.
The research map
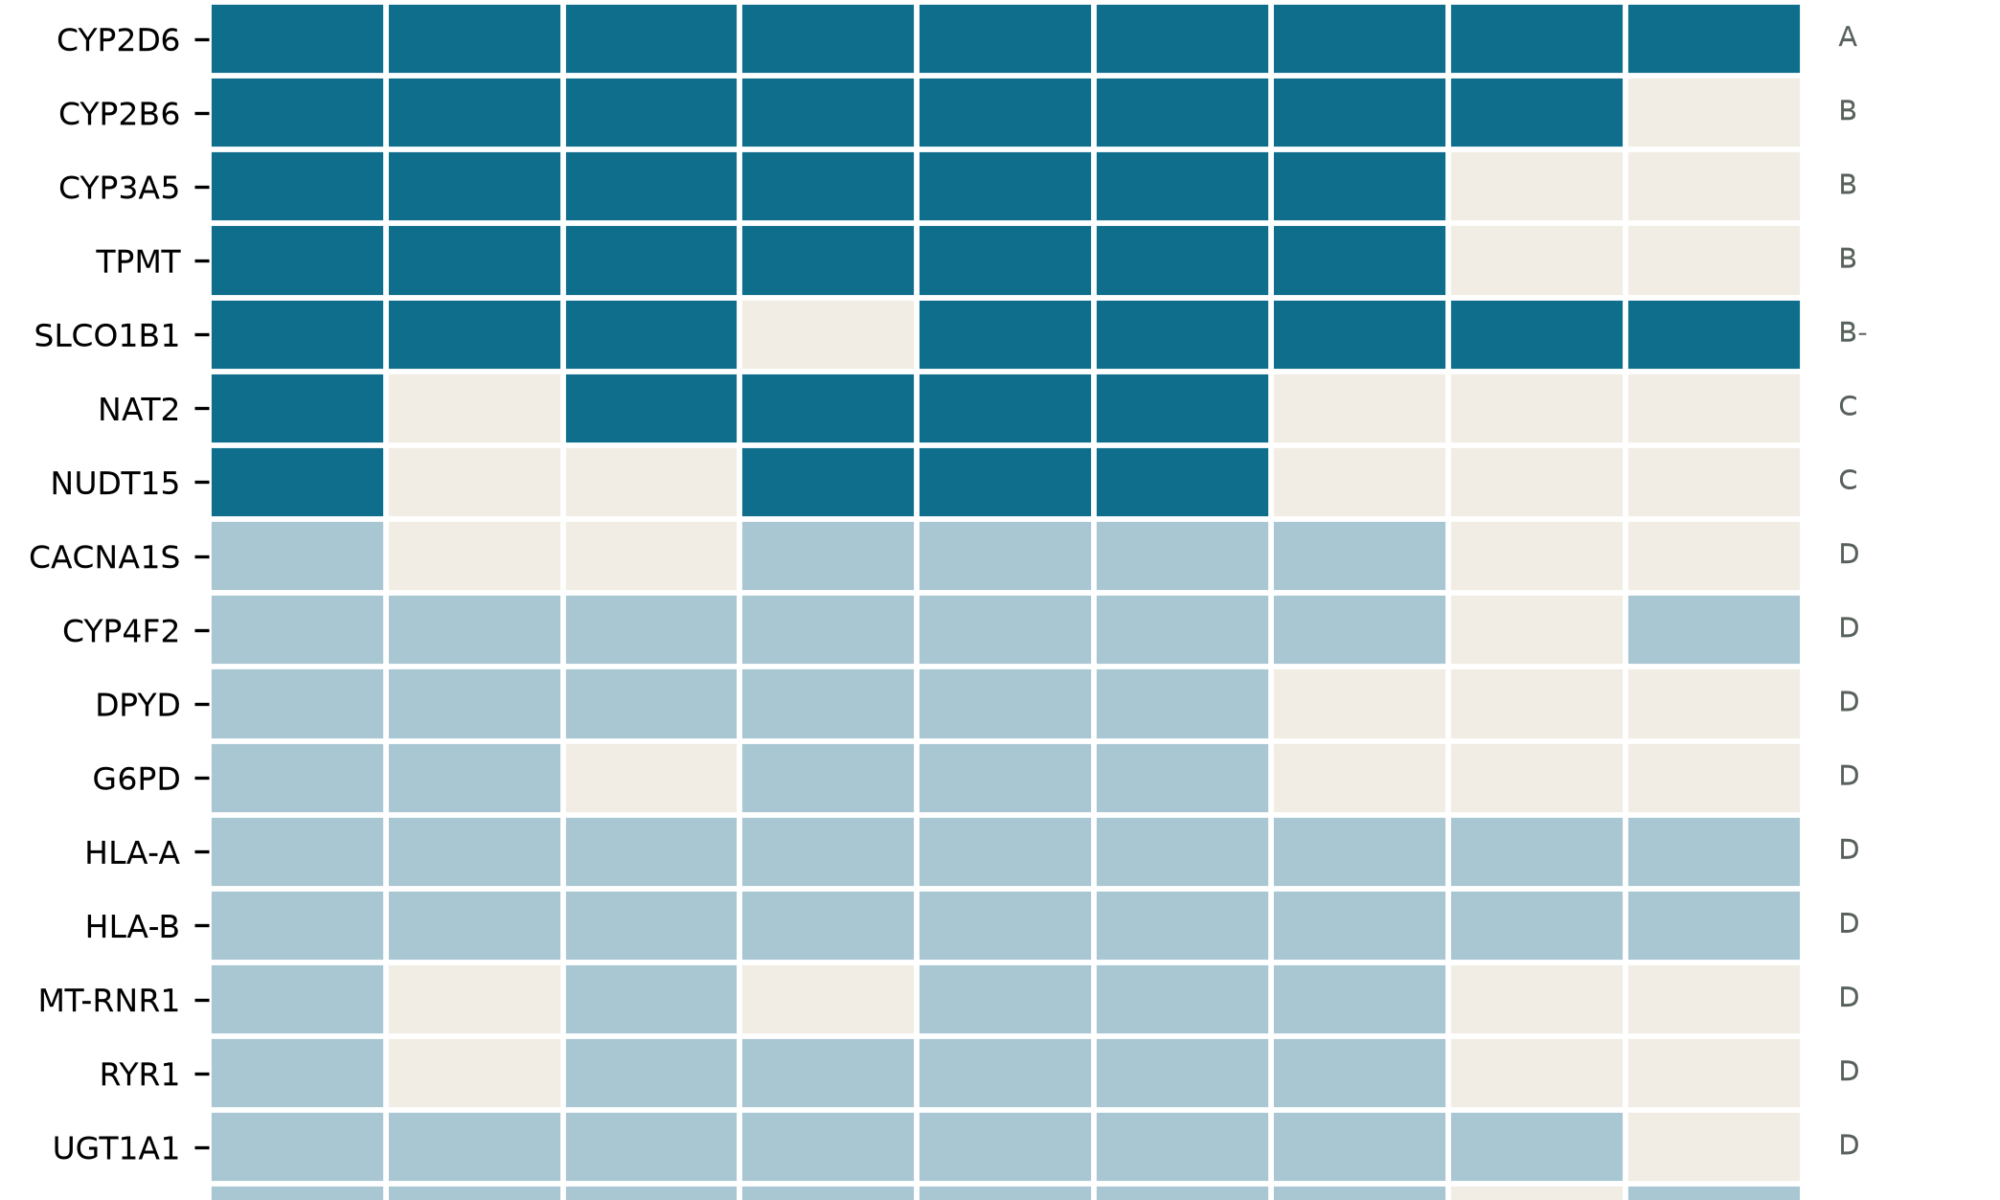
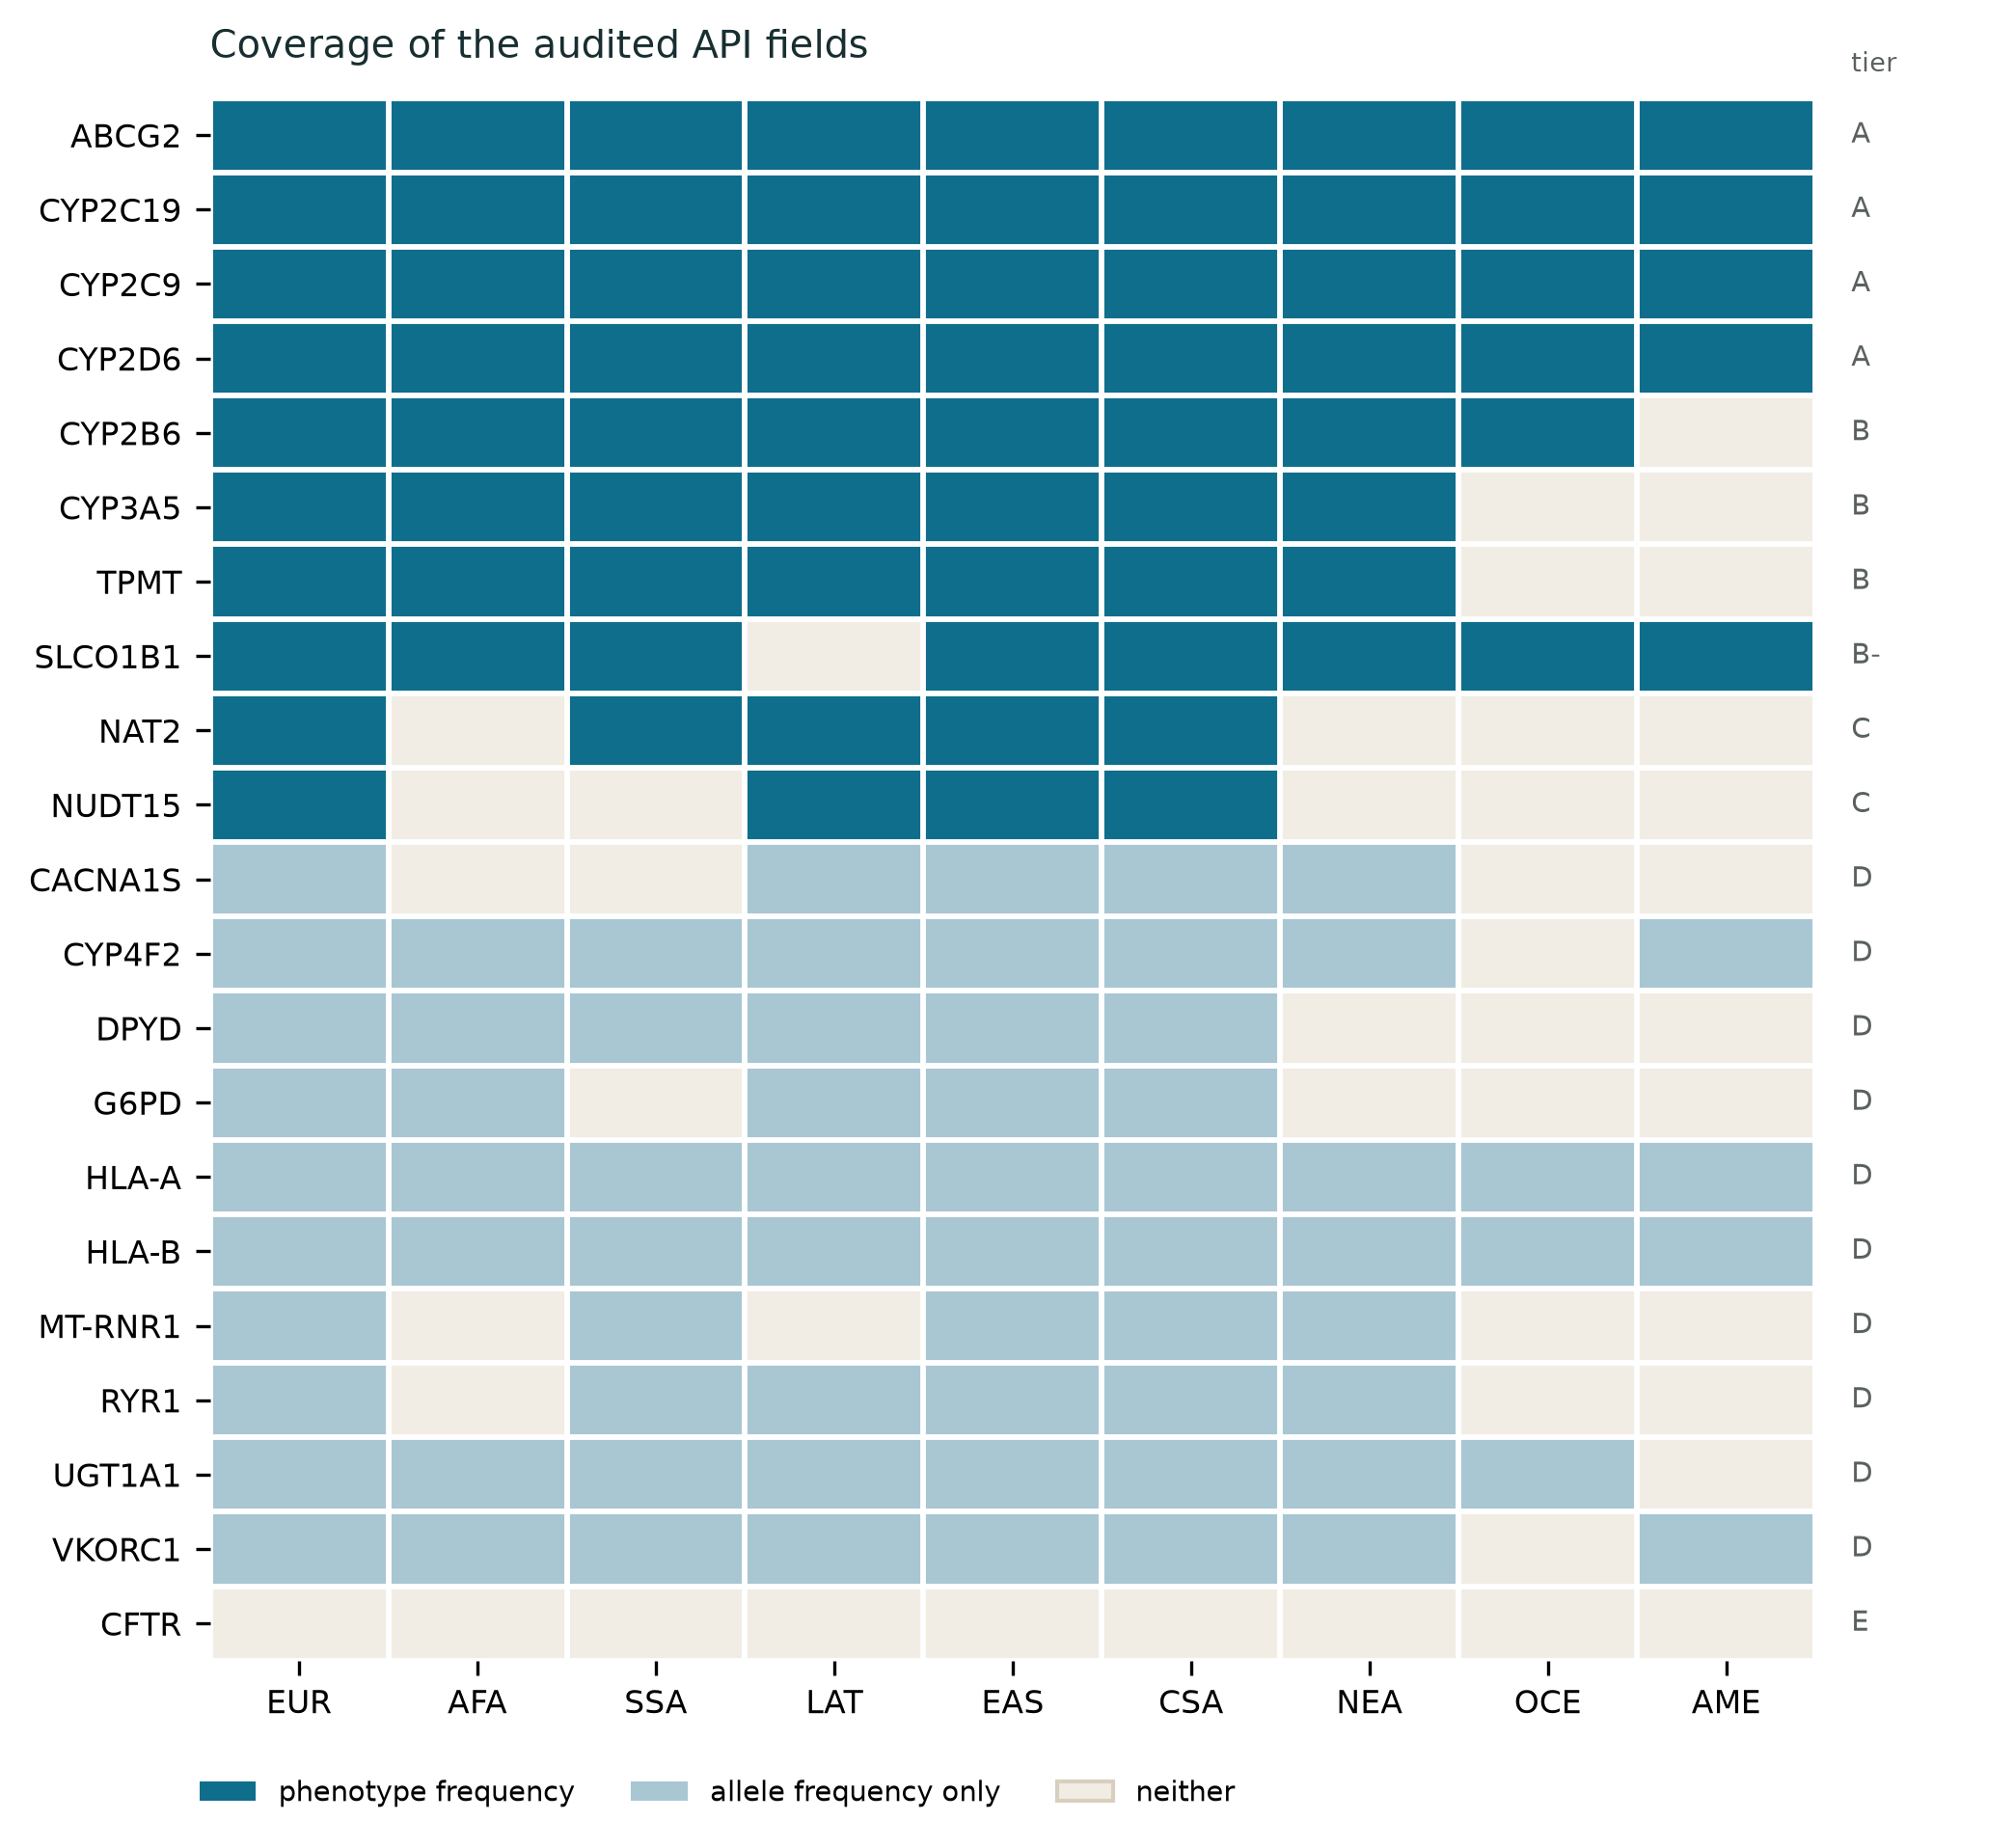
Each row is an actionable gene, each column an ancestry group, and each cell records what the snapshot contains. Dark means a computed phenotype frequency. Mid-blue means allele records only. Pale means neither.
The coverage ledger
Every actionable gene, graded by what the audited fields contain. The tier is a summary of data availability only — it is not a judgement about evidence quality, clinical importance, or the soundness of any guideline.
| Gene | Pairs | Field coverage | Groups | Tier |
|---|---|---|---|---|
| ABCG2 | 1 | Phenotype | 9/9 | A |
| CYP2C19 | 14 | Phenotype | 9/9 | A |
| CYP2C9 | 11 | Phenotype | 9/9 | A |
| CYP2D6 | 19 | Phenotype | 9/9 | A |
| CYP2B6 | 2 | Phenotype | 8/9 | B |
| CYP3A5 | 1 | Phenotype | 7/9 | B |
| TPMT | 3 | Phenotype | 7/9 | B |
| SLCO1B1 | 7 | Phenotype | 8/9 | B− |
| NAT2 | 1 | Phenotype | 5/9 | C |
| NUDT15 | 3 | Phenotype | 4/9 | C |
| CACNA1S | 7 | Allele only | 5/9 | D |
| CYP4F2 | 1 | Allele only | 8/9 | D |
| DPYD | 2 | Allele only | 6/9 | D |
| G6PD | 8 | Allele only | 5/9 | D |
| HLA-A | 1 | Allele only | 9/9 | D |
| HLA-B | 6 | Allele only | 9/9 | D |
| MT-RNR1 | 11 | Allele only | 5/9 | D |
| RYR1 | 7 | Allele only | 6/9 | D |
| UGT1A1 | 1 | Allele only | 8/9 | D |
| VKORC1 | 1 | Allele only | 8/9 | D |
| CFTR | 1 | Neither | 0/9 | E |
Tier A: phenotype frequency in all nine groups. B: seven or eight. C: six or fewer. D: allele records only. E: neither. The ledger is downloadable as gene_reference.csv.
What this audit supports — and what it does not
It supports
- The statement that 46 of the 108 selected pairs lack a computed ancestry-specific phenotype frequency in this snapshot, and that six of ten phenotyped genes cover fewer than nine groups.
- The statement that where phenotype frequencies exist, the CPIC high-priority proportion varies across groups — with the caveat that 25 pair-level spreads repeat five gene-level estimates.
- The statement that three gene–ancestry cells carry a support proxy below 100, and that their contrasts should be read with caution.
It does not support
- Any claim that 43% of clinical recommendations lack evidence. The audit measured fields in one API, not the literature.
- Any claim that a particular contrast is noise, an artefact, or a population difference. Uncertainty was not propagated.
- Any claim about prescribing, testing policy, outcomes, cost-effectiveness or research priority. None of those were measured.
- Any ancestry-specific treatment recommendation. Genotype prevalence is not harm, and this is not medical advice.
Limits
- One source, one snapshot. CPIC only; DPWG and others publish overlapping guidance. The API can change between releases.
- Fields, not evidence. An empty phenotype field does not mean guideline authors lacked data, nor that allele-level guidance is unsupported.
- Coarse categories. CPIC’s ancestry groups are administrative groupings that pool heterogeneous populations and do not describe genetic ancestry.
- Derived frequencies. CPIC computes phenotype frequencies from allele counts under modelling assumptions; we report them as published and did not propagate uncertainty.
- Attention is not risk.
ehrpriorityflags a result for clinical attention. It is not a calibrated probability of harm, and the composite mixes directions of effect. - Repeated estimates. The 61 rankable pairs are not 61 independent comparisons; they rest on nine informative gene-level estimates.
- No external replication. We did not cross-check against gnomAD or 1000 Genomes. This version contains no independent population-genomic validation.
Method
We queried api.cpicpgx.org/v1/ on 30 October 2026 and selected pairs at level A, A/B or B with usedforrecommendation = Yes. For each gene we recorded whether gene_result.frequency was populated, whether population_frequency_view contained allele records, and the largest subjectcount among those records. High-priority phenotypes are those whose ehrpriority contains “High Risk”; their frequencies were summed per group. HLA carrier frequencies use 1 − (1 − p)². The supplied analysis reports phenotype-frequency sums approximately one within each gene–ancestry cell — 71 of 75 within 0.001, with a minimum of 0.996. These source-reported checks test internal consistency, not correctness; the publisher did not independently reconstruct them from the raw API snapshot. Definitions and provenance notes accompany the processed-data download. Additional working pages are being assembled in the research library.
Sources
Primary resource: CPIC public API, snapshot date reported as 30 October 2026. See the official data-model documentation, CPIC content license and usage notes, and the related 2024 biogeographic-frequency study. No CPIC endorsement is implied.
Data
Cite this
Mikle T. An ancestry coverage audit of 108 pharmacogenomic recommendations.
Preprint draft, not peer reviewed. Version 2, 30 October 2026.
https://incoprea.com/research/pharmacogenomics-coverage/
support_n as an allele-record support proxy rather than a phenotype denominator. Removed the conclusion that the SLCO1B1 contrast is an artefact or sampling noise; the audit does not propagate uncertainty. Corrected the SLCO1B1 42.2% figure as a composite of Decreased Function (36.48%) and Poor Function (5.76%). Renamed the aggregate metric from “high-risk” to “CPIC high-priority proportion”. Removed novelty and clinical-priority claims. Added the preprint status. Version 1 is archived and unchanged.
Research, analysis and drafting were prepared with DeepSeek Harness. Internal consistency of the supplied processed tables was checked during preparation. No independent clinical review has been performed. This descriptive database audit is not medical advice.